Floating Wind Installation Sensitivity Study

Introduction

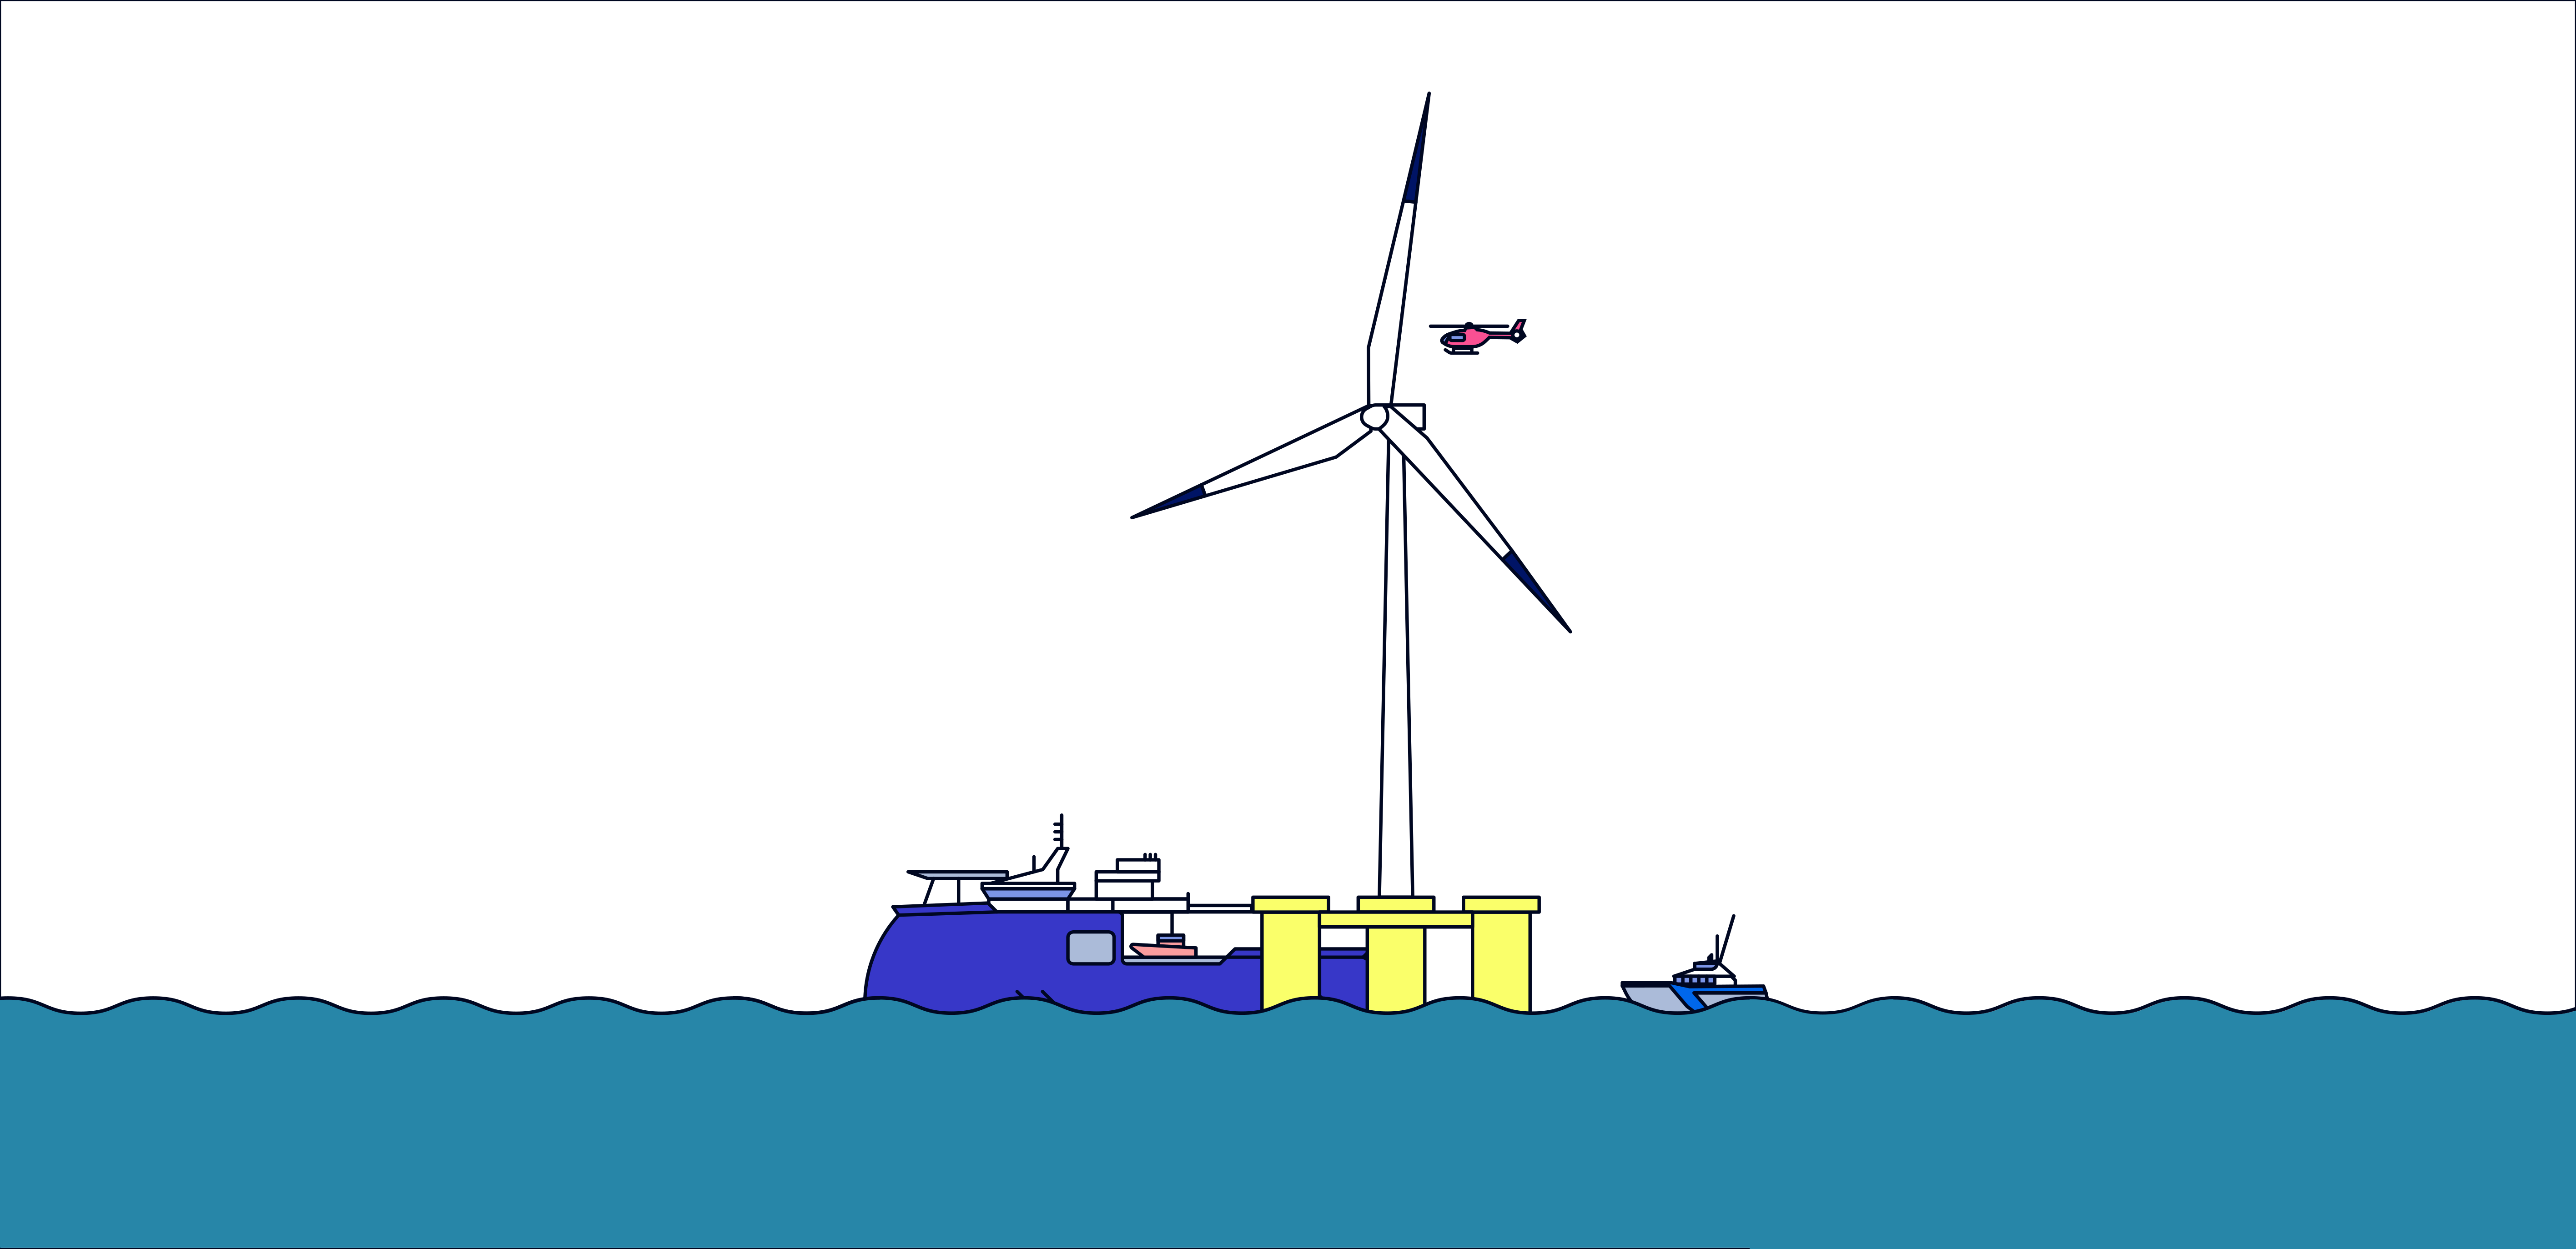
This article presents a high-level study that uses Mermaid to look at the impact of metocean conditions on installing an array of floating wind turbines at three different sites in European waters.  The aim is to demonstrate both how useful and powerful Mermaid is and to inform the reader of how sensitive to wave height the tow and installation phase can be and how this varies significantly both seasonally and geographically.

We have used Mermaid to simulate the tow out and connection to three anchors of ten turbines at a site offshore of Wales, western France and in the Mediterranean.  Read more >

Floating wind O&M case study: Comparing vessel access limitations for fixed and floating platforms

This is the first in a series of articles where we take a look at some of the challenges facing the development of floating wind and how Mermaid can be used to provide some answers and actionable intelligence.

Introduction

copyright Morek Engineering 2020

As the development of Floating Offshore Wind Farms (FLOW) gathers pace from pilot projects to the planning of whole arrays there are a range of new technical challenges that need to be met.  One of these is the assessment of how vessels can access a floating turbine during O&M activities.  Read more >

Modelling wind farm installation in US waters

As the offshore wind industry gathers pace in US waters, we thought it would be a good time to illustrate the importance of simulating complex installation schedules to support efficient offshore planning.

It is common knowledge to the industry that US regulations mean that the installation of wind farms in US waters are restricted in their use of foreign vessels.  In particular, the ‘Jones Act’ dictates that vessels transporting goods between two US locations need to be US built, flagged and owned.  Read more >

Time series variability blog

How do different aspects of the input metocean data affect Mermaid results?

There are a range of sources of variability when it comes to putting together a Mermaid analysis, and they can all affect the output statistics to various degrees.  It could be subtle changes such as weather thresholds, task durations or the level of suspendability; or more strategic changes such as vessel and port choice.  But that’s what Mermaid is designed for, for you to be able to tweak and optimise your operation to minimise the weather risk. Read more >

Comparison of using Mermaid metocean data against a higher quality dataset

With the recent addition of access to a 10-year hindcast dataset within Mermaid we thought it would be a good idea to provide some handy guidance and advice on how it should be used.

The general aim of this dataset is to allow users to generate some ‘headline’ average duration statistics that will be useful for things such as writing or reviewing bids and operation overviews.

The key things to be aware of with this dataset are threefold:

  1. The duration of the dataset is ten years (January 2006 to December 2015)
  2. The time step of the wind data is three hours whereas it is six hours for the wave data
  3. The horizontal grid resolution is 0.25°, i.e.
Read more >

Vessel Utilisation – Part 5: The analysis of results outside Mermaid

Introduction

In the last part we looked at how we can use Mermaid outputs to perform a bespoke analysis and discussed the process of writing a script to extract additional information.  This example is reasonably simple, but the timestep by timestep nature of the results allows substantial detail to be considered.

In this post we’ll take a look at the results we generated by running this script on our cases, considering only simulations starting in June.  We’ll also consider the process we have undertaken and the impact that this type of analysis can have on the success of a project. Read more >

Vessel Utilisation – Part 4: An overview of bespoke post processing

Introduction

So far in this series we have prepared and run a number of simulations and considered the results in Mermaid, all with the aim of answering the question:

“When should we take the trenching vessel on hire, relative to the installation vessel?”

We saw in the last post that our base case offset (32 days) is a fairly good position, however, we think there might be opportunity to improve on this.  The issue we have is that our post-processing requirement is outside the type of charts and tables offered by Mermaid.  Read more >

Vessel Utilisation – Part 3: The analysis of results using Mermaid

Introduction

Last time we finished the setup of the analysis by preparing the flow diagram.  We considered a number of options for modelling these tasks, ultimately selecting a clean, simple and easy to maintain approach.  We also performed a number of simulations.

In this post we will take a look at the results we have generated and will consider the impact these can have on our decision making.  Finally, we’ll make some decisions regarding the next steps we should take.

Box Whisker Charts

In this post we are going to analyse our results using Mermaid’s “Duration Box Whisker Charts”, here’s a quick overview of the data represented by different elements of these. Read more >

Vessel Utilisation – Part 2: The simulation of cable lay operations

Introduction

Last time we outlined the analysis of cable installation operations for a hypothetical operation at WaveHub.  We looked at the map and the shelter characteristics of the vessels we intend to use and outlined the main objective of the analysis, which is:

“When should we take the trenching vessel on hire, relative to the installation vessel?”

In addition we sketched out our operations, at quite a high level, ahead of putting them in to Mermaid, this sketch is shown below:

Overview Flow Diagram

In this post we are going to look at how we can model these operations in Mermaid and consider, in a little more detail, how we vary the length of the lay and trench operations. Read more >